Close Menu
    Facebook X (Twitter) Instagram
    • About US
    • Privacy Policy
    • Disclamer
    • Our Team
    • Terms Of Service
    • Contact Us
    Facebook X (Twitter) Instagram Pinterest Vimeo
    Libra
    • Altcoin
    • Business
    • News
    • Features
    • Crypto
    • Market
    • Blockchain
    • ICO News
    • NFT
    Subscribe
    Libra
    Home»News»BTC Moves Laterally With Halving on the Horizon, Analysis Indicates Possible Retreat
    News

    BTC Moves Laterally With Halving on the Horizon, Analysis Indicates Possible Retreat

    Alexandra StoneBy Alexandra StoneAugust 24, 2024No Comments2 Mins Read
    Share Facebook Twitter Pinterest LinkedIn Tumblr Reddit Telegram Email
    Share
    Facebook Twitter LinkedIn Pinterest Email

    Bitcoin, the biggest cryptocurrency in the world by market size, has been trading in a tight range this past week. As of April 6th, 2024, its price is about $68,978.01. It’s slightly up by 1.29% in the last day, based on CoinmarketCap’s data.

    Bitcoin continues to lead, holding a market value of over $1.3 trillion. This keeps it at the top spot in the cryptocurrency world. The trading volume in the last 24 hours is $27.8 billion, which is 26% less than usual, but this drop is expected on weekends. Still, BTC is second in trading volume in the crypto market.

    bitcoin 24-hours Chart: Source Marketing Cap

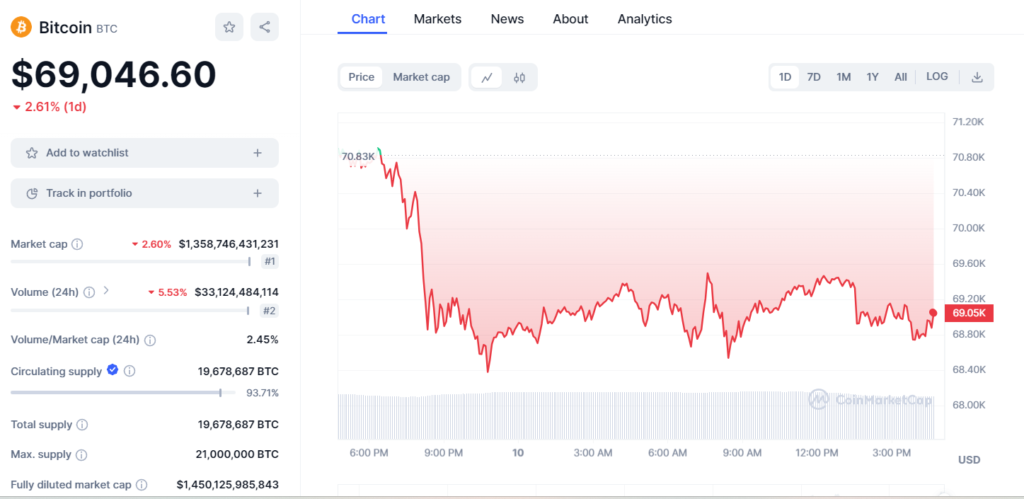
    There are now 19,674,750 BTC in circulation, which is 93.69% of its total possible supply of 21,000,100 BTC.

    Weekly Bitcoin Analysis- A Chance to Buy More?
    Looking closer at Bitcoin’s weekly price movements, it seems to be in a downtrend, trading in a zone between $59,230 and $53,003. Experts think this area is good for buying more Bitcoin, expecting a dip. If prices drop, it could be a chance to buy at these lower prices.

    Some think Bitcoin might drop below $60,100 to adjust for market trends before possibly climbing back up to its highest price of $73,845. It’s not unusual to see prices drop before a halving event, when the amount of Bitcoin mined gets cut in half.

    Daily Chart: Bitcoin’s Uncertain Path
    On the daily chart, Bitcoin’s direction isn’t clear. It’s stuck between its highest ever price and the $60,781 level. If it goes above its high and then drops, it might mean prices will fall in the short term.

    If there’s more buying, it might keep going up. If it closes above $69,000, it could try for the high again or even reach up to $75,050.

    With the Bitcoin halving event coming up, experts think the market will have small chances to “buy the dip” in an overall upward trend.

    Share. Facebook Twitter Pinterest LinkedIn Tumblr Email
    Previous ArticleAave (AAVE) Price Stability: A Sign of Maturing DeFi Market?
    Next Article Bitcoin and Ethereum Spearhead Market Comeback
    Alexandra Stone
    • Website

    Alexandra Stone, Editor-in-Chief: With over 15 years of experience in financial journalism, Alexandra leads our editorial team with an unwavering commitment to integrity and quality. She has a knack for cutting through market noise to bring clarity and insight to our readers.

    Add A Comment
    Leave A Reply Cancel Reply

    • Recent Posts

    Head of DOGE VIVEK Sees Meteoric Rise In Volatile Crypto Market

    November 20, 2024

    MAGA Coin Surges As Crypto Market Embraces Political Branding

    November 20, 2024

    Bitcoin Falls Below 70000 As Crypto Market Slumps

    November 1, 2024

    Ripple Releases 1 Billion XRP In Monthly Escrow Unlock

    November 1, 2024

    GoldenRat Cryptocurrency Surges Amid Market Volatility

    November 1, 2024

    Crypto Newcomer LUCE Skyrockets 76% In 24 Hours

    October 30, 2024
    • About US
    • Privacy Policy
    • Disclamer
    • Our Team
    • Terms Of Service
    • Contact Us
    © 2025 ThemeSphere. Designed by ThemeSphere.

    Type above and press Enter to search. Press Esc to cancel.